Empowering PNW Communities to Keep Forests Healthy
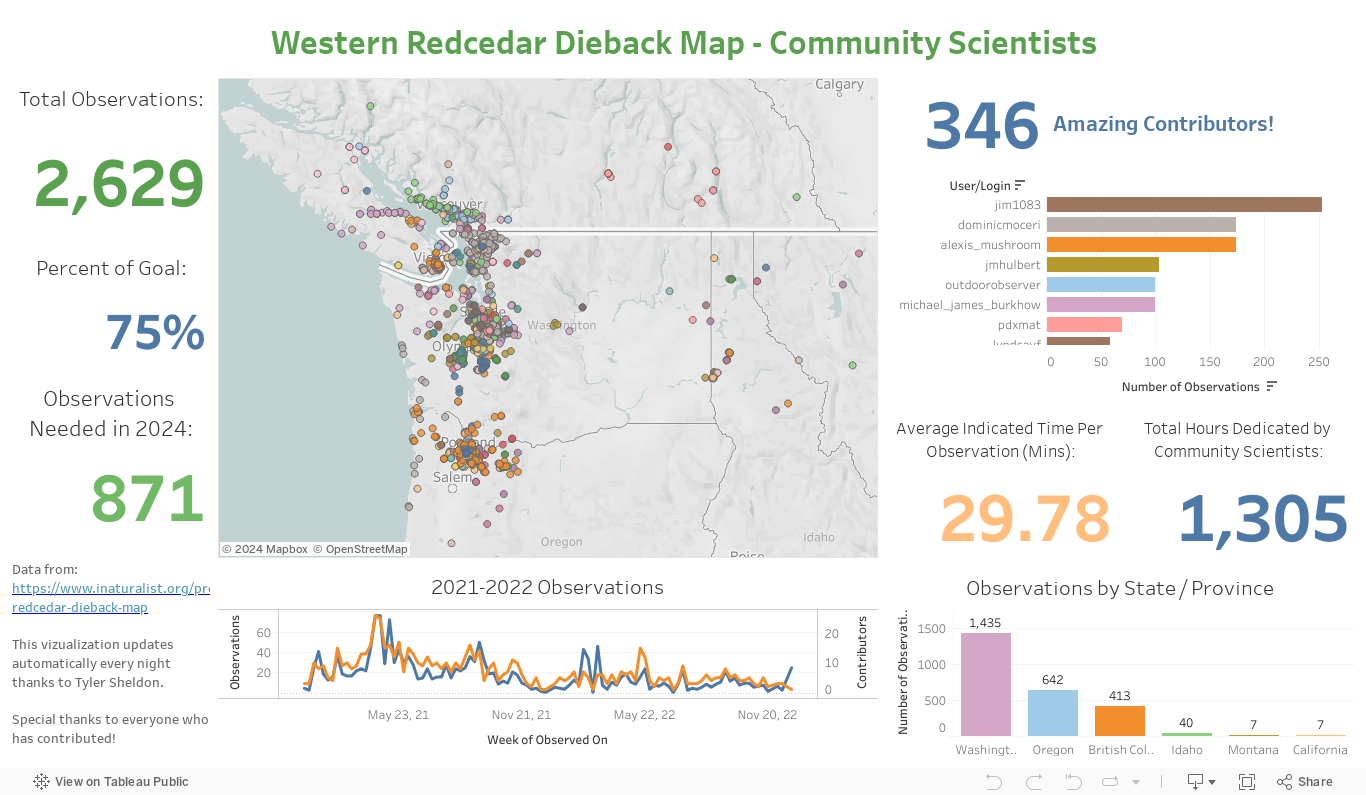
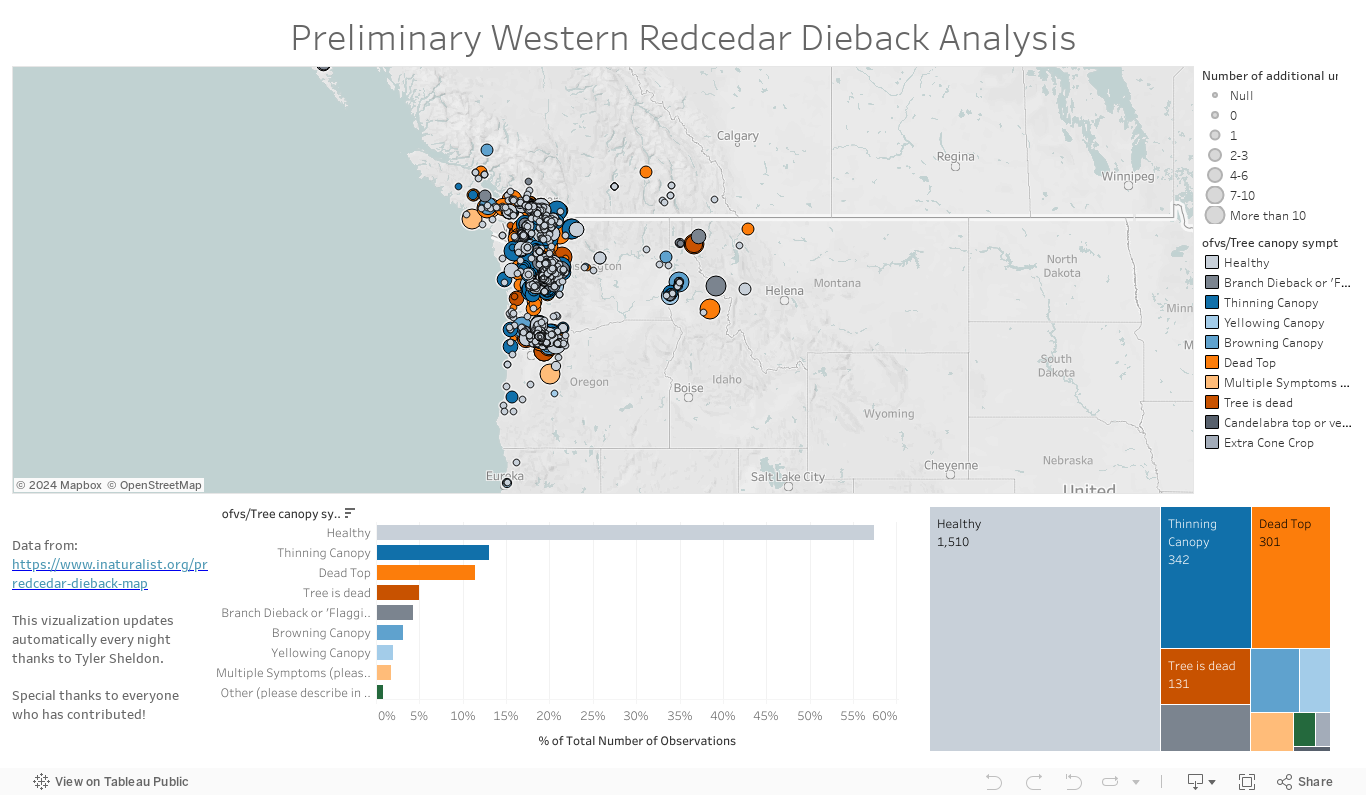
Western Redcedar Dieback Map - Preliminary Analyses
visualizations update daily
Attend an upcoming Research Update for a more thorough look at this information.
1300+ Observations! Now what?
We’re thrilled to share we have started preliminary analyses of the data.
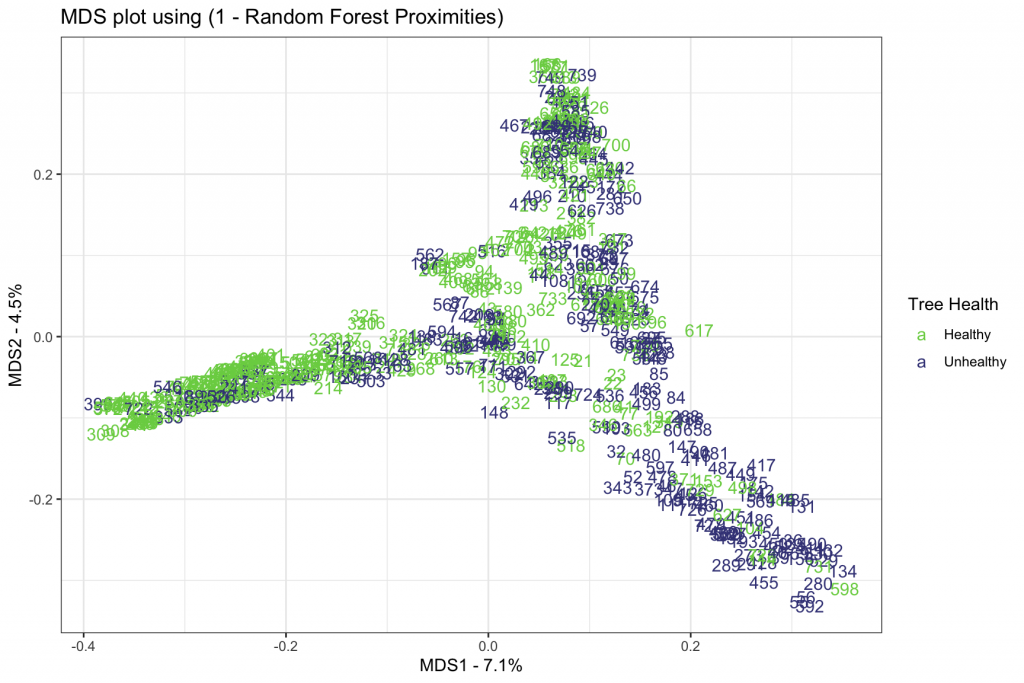
This (preliminary) data visualization shows how healthy and unhealthy trees group differently when plotted against a combination of environmental factors (soil, climate and topography).
The next steps are to identify what factors are most important for whether trees are classified as healthy or unhealthy.
Attend one of our monthly research updates to learn more!